Linear regression — a sketchbook
In one sentence
You have points. You draw a straight line through them. After that the line is a prediction machine: x in, ŷ out.
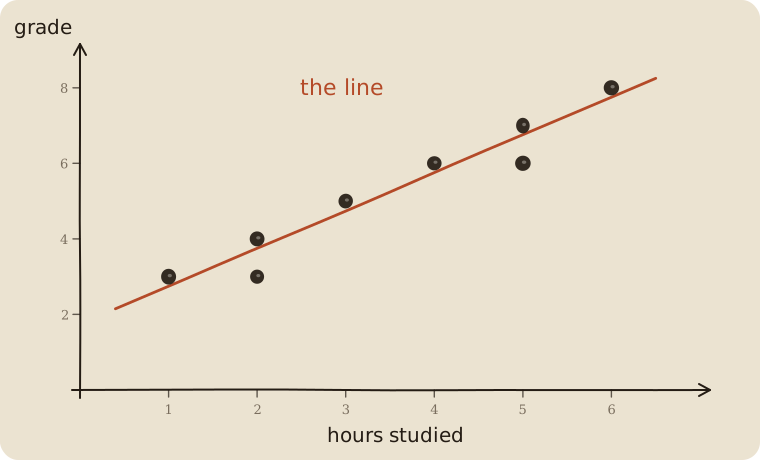
Page 1 — The problem
You want to know how a grade depends on hours studied.
You ask 8 people:
| hours studied | grade |
|---|---|
| 1 | 3 |
| 2 | 4 |
| 2 | 3 |
| 3 | 5 |
| 4 | 6 |
| 5 | 7 |
| 5 | 6 |
| 6 | 8 |
This is not a law. Person A studies 2 hours and gets a 3. Person B also studies 2 and gets a 4. Life is noisy.
Still, you can see a direction: more hours → tend to mean a better grade.
Question of the whole sketchbook:
Can I turn x (hours) into a decent guess for y (grade)?
Not perfect. Good enough.
Page 2 — Points are a cloud
Each person = one dot.
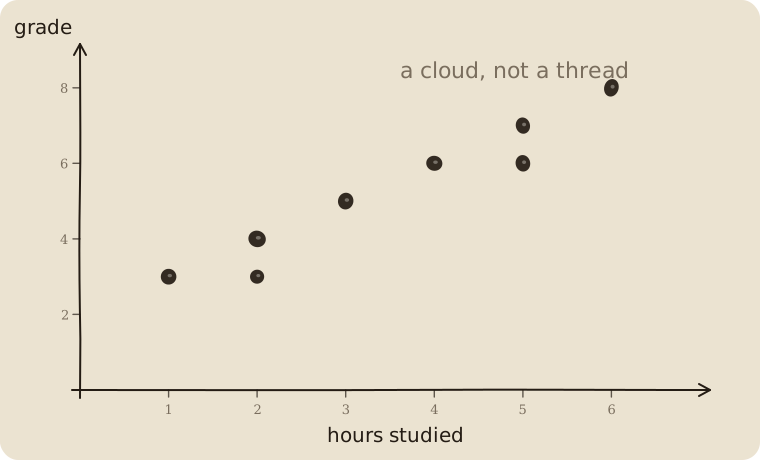
That is a cloud of points.
You can already see some things without math:
- The cloud rises to the right. Positive relationship.
- It is not thin like a thread. There is scatter.
- You do not need a curve here. A straight line is a decent model.
Margin note
Cloud rises: positive trend. Cloud falls: negative trend. Looks like a round blob: no linear trend. A line would be nonsense.
Page 3 — The line is the answer
You put a straight line through the cloud.
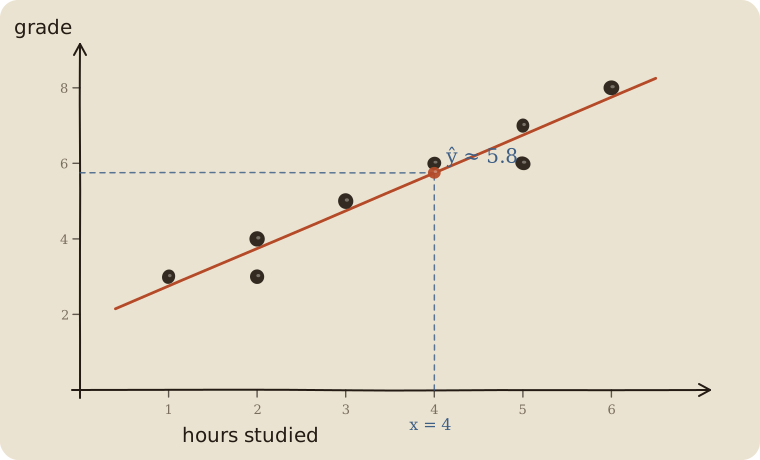
The line does not say: “This is the world.” It says: “Roughly, on average.”
Someone with 4 hours:
line at x = 4 → ŷ ≈ 5.8
The hat on the y (ŷ, “y hat”) means: prediction, not the real grade.
Real grade next to it: 6. Prediction: 5.8. Off, but close. That is the deal.
Page 4 — Two numbers run everything
Every straight line on paper has exactly two knobs:
ŷ = a + b · x
- a — intercept. Where the line hits the y-axis.
- b — slope. How steep.
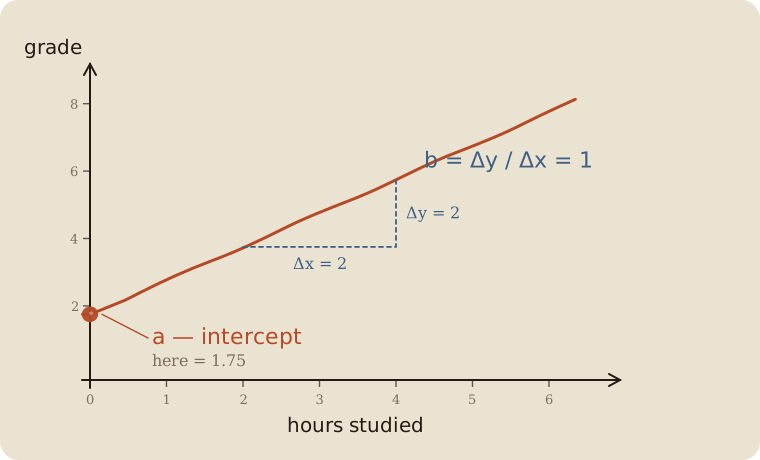
a — the start
What comes out when x = 0?
Here: 0 hours studied. The line hits the grade axis at a = 1.75.
Sometimes a is meaningful (“base rent, before anything happens”). Sometimes a is just math and nonsense outside the data — nobody sits an exam with −3 hours of studying.
b — the slope
What happens when x grows by 1?
For our 8 people, b = 1. Each extra hour goes with +1 grade point, on average.
Other lines, other b — just to feel the knob:
| b | means |
|---|---|
| +1 | each extra hour: grade +1 on average (this cloud) |
| −0.4 | each extra hour: grade −0.4 on average |
| 0 | x does nothing. Flat line. |
The sentence to keep:
b is the average change in ŷ when x grows by 1.
Not for one person. For the pattern in the cloud. Not a cause — that is extra (01 confounding).
Page 5 — Mini picture: touching the slope
Two points on the line:
- A: 2 hours → grade 3.8
- B: 5 hours → grade 6.8
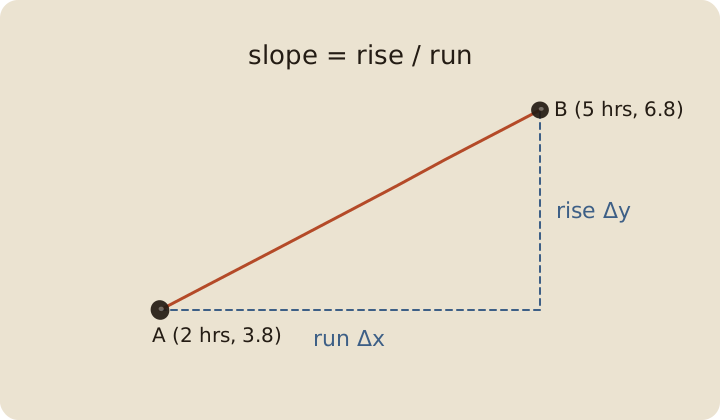
Slope = rise over run. School math — except the line does not have to go through two points. It has to go through a whole cloud.
Page 6 — The error is vertical
The line almost never hits the point exactly. The gap up / down is the error.
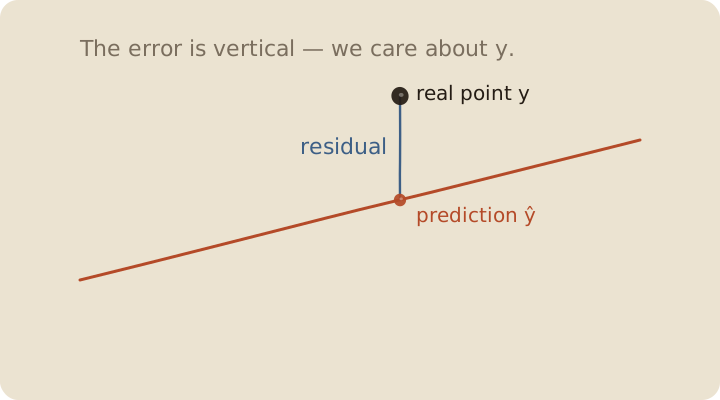
residual = real − prediction = y − ŷ
- residual positive: point sits above the line. Better than the model thought.
- residual negative: point sits below. Worse than expected.
- residual 0: bullseye. Rare.
Why vertical, not diagonal onto the line? Because we are predicting y. We care about: how far off was the grade? Not the slanted distance on the page.
Under ordinary least squares (the default line, next page), the mean of all residuals is always exactly 0. The overs and the unders cancel. That is why adding them raw is useless — and why we square. It is also why the line is forced through the centroid of the cloud (page 10): the average leftover is zero, so the average point sits on the line.
Page 7 — Which line is “the best”?
You could draw a thousand lines through the cloud. Most of them are bad.
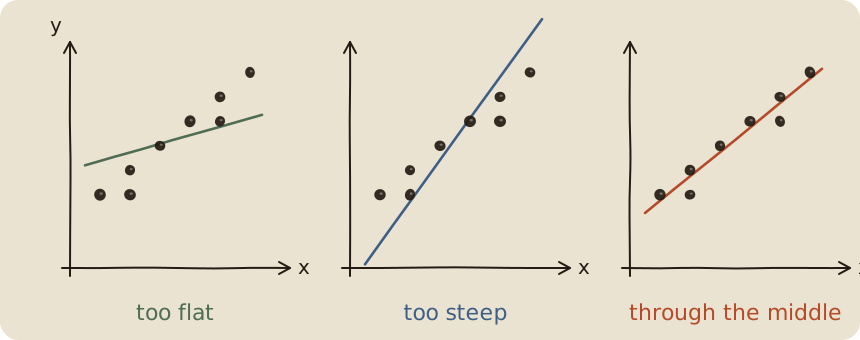
Idea: make the residuals small.
Naive thought: add all residuals. Problem: +2 and −2 sum to 0. Looks perfect. Is not.
So the classic recipe:
- Take each residual.
- Square it. (Negatives become positive. Big misses get extra loud.)
- Add them up.
- Find a and b where that sum is smallest.
That is least squares. Sounds like a spell. It is only: punish big misses hard.
A point 4 grades off costs 16. Two points 1 grade off cost 2. So outliers yank the line toward themselves.
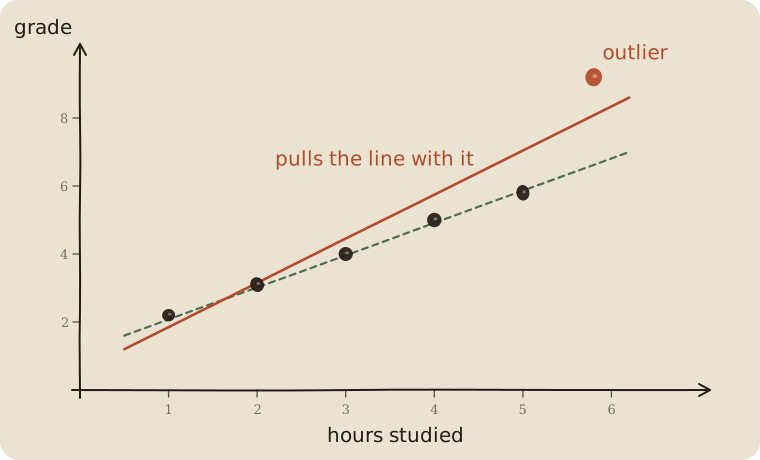
Why square?
You could use absolute values (|residual|) instead. That is a different method. Squares are the default recipe because they are smooth and they shout at large errors.
Page 8 — Using the machine
The best line for the 8 people is (no rounding; the data are tidy):
Then:
| hours | calculation | prediction ŷ |
|---|---|---|
| 0 | 1.75 + 1·0 | 1.75 |
| 2 | 1.75 + 1·2 | 3.75 |
| 4 | 1.75 + 1·4 | 5.75 |
| 6 | 1.75 + 1·6 | 7.75 |
Someone studies 3 hours:
You do not say: “You will get a 4.75.” You say: “People like you landed around 4.8, on average. Scatter extra.”
The line is an average-maker, not an oracle.
Page 9 — What “linear” actually means
Linear here does not mean “the world is simple.” Linear means: the effect of x is the same size everywhere.
+1 hour at 1 hour → +1 grade +1 hour at 5 hours → +1 grade (same b)
The line has no bend. No plateau. No “after 4 hours it stops helping.”
If the truth looks like this:
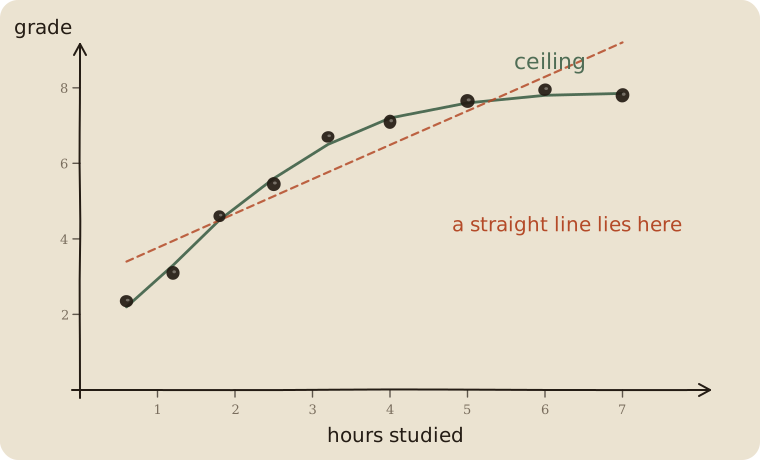
…then a straight line is the wrong tool. It cuts the curve and lies at both ends.
Later you might want other models (a curve, steps, trees). For now it is enough: straight line = constant effect.
Page 10 — A tiny example you can feel
Four points, deliberately small. Just so the trick lands.
| x (hours) | y (grade) |
|---|---|
| 1 | 2 |
| 2 | 4 |
| 3 | 5 |
| 4 | 7 |
Means (the “centroid” of the cloud):
The best line always goes through the centroid (x̄, ȳ). Keep that.
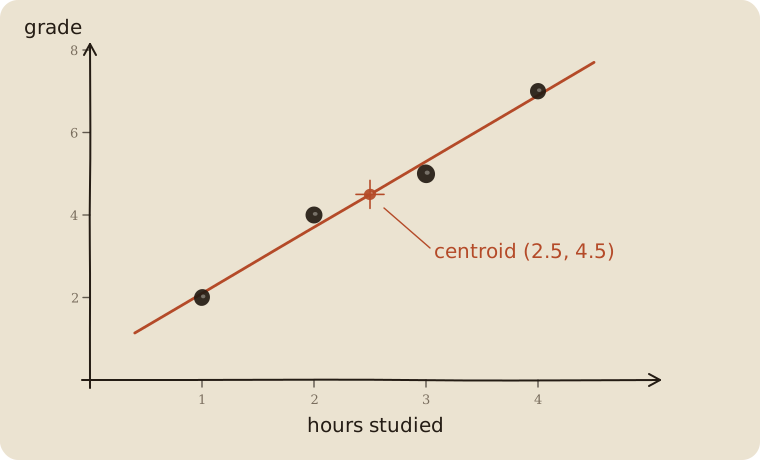
Slope from how x and y walk together:
Check:
| x | ŷ | real y | residual | residual² |
|---|---|---|---|---|
| 1 | 2.1 | 2 | −0.1 | 0.01 |
| 2 | 3.7 | 4 | +0.3 | 0.09 |
| 3 | 5.3 | 5 | −0.3 | 0.09 |
| 4 | 6.9 | 7 | +0.1 | 0.01 |
Sum of squares = 0.20. Tiny. The line sits tight.
You do not have to do this by hand every time. The computer does exactly that — just with more points. Your head only needs: centroid + slope + small residual².
Page 11 — R² in one minute
How good is the line?
Without x, best guess is the average ȳ. A flat line. R² against that is 0.
With x, a slanted line. R² is how much of the scatter that line explained away.
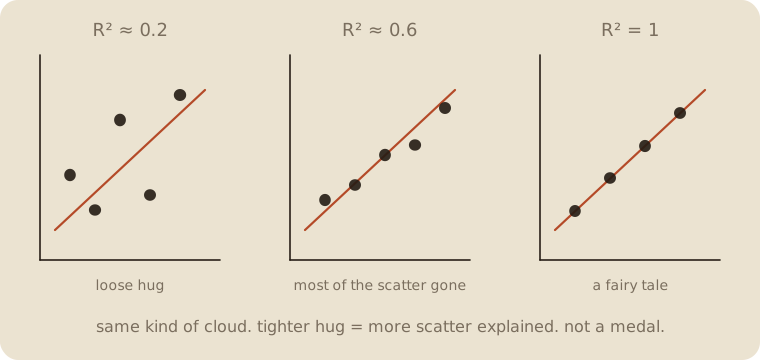
| R² | means |
|---|---|
| 0 | Line is useless. As good as the plain average. |
| 0.5 | Half the scatter explained. Okay. |
| 1 | Every point sits exactly on the line. A fairy tale. |
R² = 0.8 sounds great. It does not mean x is the cause. It only means the points hug the line.
0.6 is not a medal and not a fail. It is 60% of the scatter explained — on these people. New people: usually less. Compare to the flat average (R² = 0), not to a textbook “good.”
Page 12 — Correlation is not cause
Classic trap, everyone falls in once:
Ice cream sales and drownings rise together. So ice cream causes drowning?
No. Both rise because it is summer. A third variable.
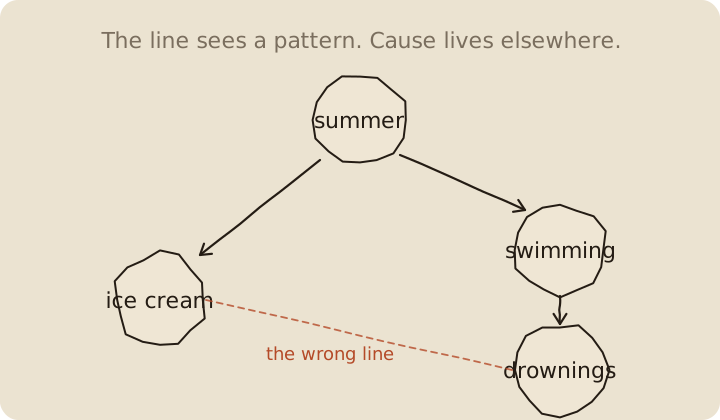
The line between ice cream and drownings would be steep and “significant” — and still wrong as a story.
Linear regression finds patterns. Cause is on you: experiment, time, domain knowledge.
More traps:
| trap | picture |
|---|---|
| outlier | One far-away point yanks the whole line |
| measure only one range | Infer from 18-year-olds to toddlers |
| predict past the data | Line at x = 200 hours → grade 220. Nonsense |
| y drives x | Bad grade → then more studying. Arrow the wrong way |
Page 13 — More than one x
So far: one x. Hours, a line.
Often you have two levers. Hours and sleep. Same machine. The picture changes:
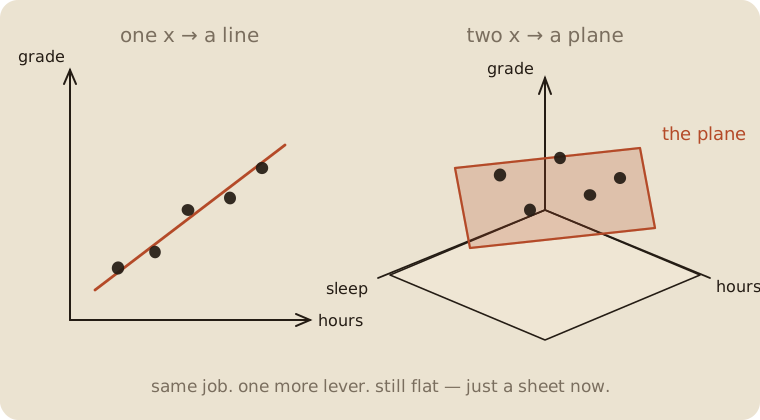
Still “linear”: each lever has one fixed add-on. No bend. Only now the fit is a flat plane through a 3-D cloud, not a line through a 2-D one.
Each b is still “+1 on that lever, on average.” The new phrase: holding the other lever still. Without it you misread b. (The eight people on page 1 have no sleep column. This page is the shape, not a fitted number.)
A third lever is the same trick in a space you cannot draw. If two levers say almost the same thing — hours studied and minutes studied — they fight. One b goes huge, the other huge the other way. Net effect maybe fine; the story is garbage. The textbook name is multicollinearity. Ridge is the seatbelt (02 ridge regression).
Page 14 — More than one x: scale
One x, one unit: skip. Hours in 1–6. Least squares does not care how you spell it. The line is the same.
Two or more levers: scale. Hours, minutes, sleep. Different spellings. The guesses stay the same if you only change units. The knobs do not. A tiny b on minutes can be a huge b on hours — same fact, different writing.
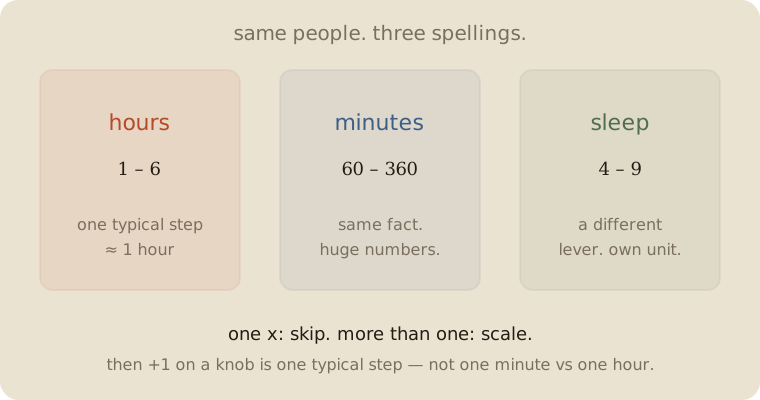
Recipe, before you read the bs:
- Subtract each x’s average.
- Divide by its spread.
- Then fit.
Now +1 on a knob is one typical step of that lever, not “one minute vs one hour.” You can compare bs. You still cannot infer cause.
A later tax on size (02 ridge regression, 03 lasso) needs this, or it taxes spelling. The eight people below have one x. That fit stays unscaled on purpose. The habit starts here.
Page 15 — What the computer does inside (no panic)
You do not need to derive the formula. Just see the landscape.
Think of a and b as coordinates on the floor. At every pair you measure the sum of squared errors from page 7. That pile is a height. The heights make a bowl.
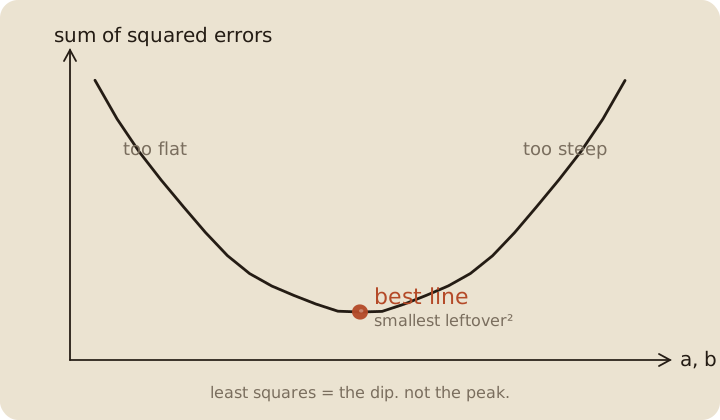
The best line is the bottom of the bowl — leftover² as small as it can get. That is why people say least squares, not most. The rust blob is the dip, not a peak.
The computer rolls downhill and stops. Done.
For a straight line there is one clear dip. That is why simple linear regression is well-behaved: one answer, no magic. When there is no formula for the bottom, you walk the bowl: 01 gradient descent.
Page 16 — Mini recipe
- Question. What do I want to predict? That is y.
- Lever. What do I have beforehand? That is x. (Or several x.)
- Draw the points. Look at the cloud. Rising? Bent? Outliers?
- More than one x? Scale first. Then the knobs speak one language.
- Draw the line. Computer: least squares.
- Read b. “+1 on x goes with +b on y.”
- Look at residuals. Systematic misses? Then the line is too dumb.
- Treat R² as volume, not as truth.
- Think about cause separately. Pattern ≠ mechanism.
If you keep only one thing:
cloud → line → ŷ = a + b x. leftover is vertical. more than one x: scale. pattern ≠ cause.
Page 17 — Eight people, in sklearn
Same eight rows as page 1. One x. Least squares. Scale would not change this story — page 14. Just the line.
from sklearn.linear_model import LinearRegression
import numpy as np

hours = np.array([1, 2, 2, 3, 4, 5, 5, 6]).reshape(-1, 1)
grade = np.array([3, 4, 3, 5, 6, 7, 6, 8])

line = LinearRegression().fit(hours, grade)
print(f"ŷ = {line.intercept_:.2f} + {line.coef_[0]:.2f} · hours")
print("3 hours →", round(line.predict([[3]])[0], 2))
print("4 hours →", round(line.predict([[4]])[0], 2))
print("R² =", round(line.score(hours, grade), 3))
ŷ = 1.75 + 1.00 · hours
3 hours → 4.75
4 hours → 5.75
R² = 0.936
Same numbers as the sketchbook. .score is R² on these eight people — pride, not a test. Next person: a split (01 train test validate). Two levers tomorrow: scale first, then fit.
Last page — cheat sheet
| symbol | meaning |
|---|---|
| ŷ = a + b x | the line |
| a | intercept (x = 0) |
| b | slope: +1 x goes with +b on ŷ (pattern, not cause) |
| ŷ | prediction (“y hat”) |
| y | real value |
| y − ŷ | residual / error |
| R² | share of scatter explained on these people (can go negative on new people) |
| scale | more than one x: subtract average, divide by spread. then bs are comparable |
Also called (in a room):
| here | there |
|---|---|
| leftover | residual |
| lever / x | feature |
| knob b | coefficient / weight |
| cloud | scatter |
Best line = smallest sum of (residuals)². It always goes through the centroid (x̄, ȳ).
linear — effect the same size everywhere (no bend). cause — extra. Not inside the formula.
Use / skip
Reach for it when
- y is a real number
- the cloud looks like a straight smear
- you want a sentence: “+1 on x goes with +b on y.”
Skip it when
- y is yes/no (01 logistic regression)
- y is a count that cannot go negative (06 GLM)
- the cloud bends
- one point yanks the line (check the cloud, or a method that does not square the miss — ridge is for huge knobs, not that yank)
- you have more levers than people
Pays you: simple, fast, knobs you can read. The starting machine.
Costs you: no legal region for ŷ. Outliers scream. Twin x fight (multicollinearity). Cause is not in the formula. More than one x: scale, or you read spelling. A later tax on size (02 ridge regression, 03 lasso) needs that too.
Sketched as a notebook, not a lecture. If the line goes feral: 02 ridge regression. If y is yes/no: 01 logistic regression.